Appex 01 – Welcome Penguins!
STA 363 - Spring 2023
Set up
Login to RStudio Pro
- Note: if you are off campus, you will need to use a VPN to connect
- Go to rstudio.deac.wfu.edu
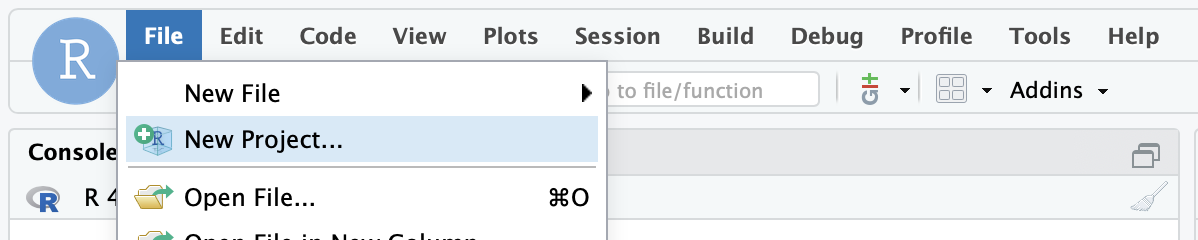
Step 1: Create a New Project
Click File > New Project
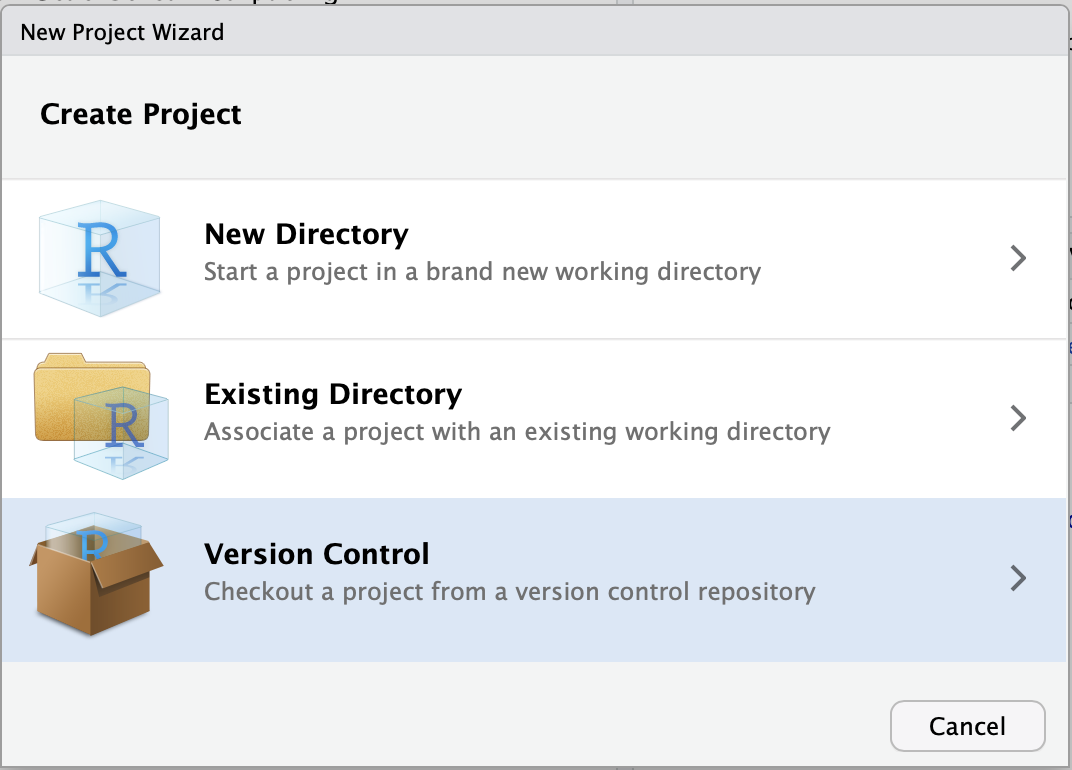
Step 2: Click “Version Control”
Click the third option.
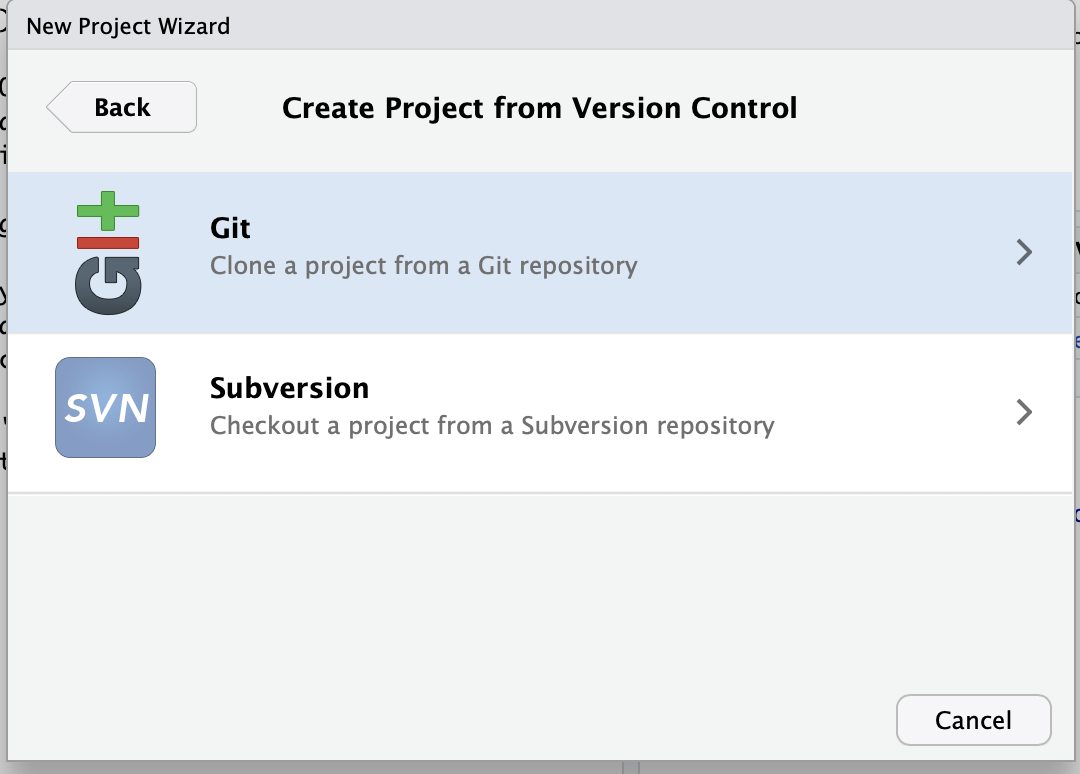
Step 3: Click Git
Click the first option
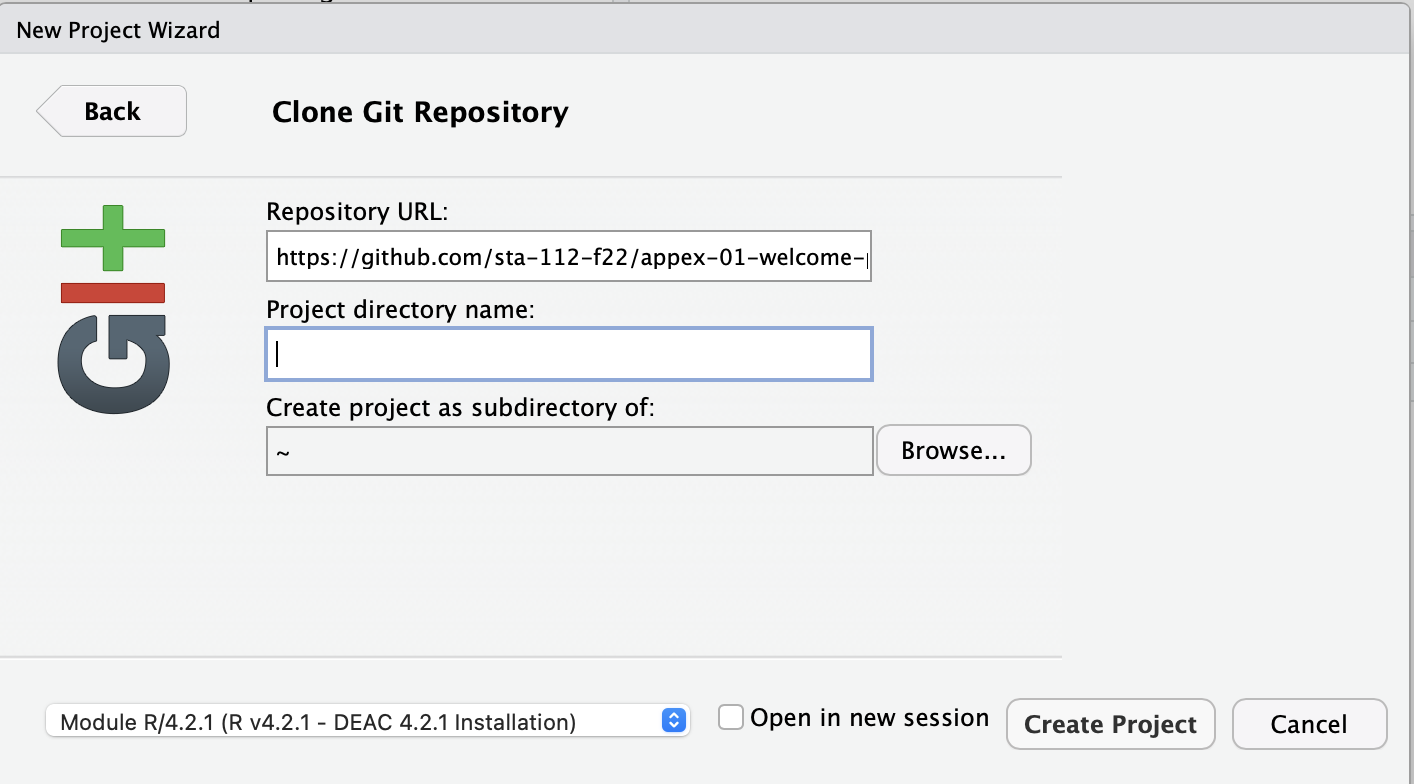
Step 4: Copy my starter files
Paste this link in the top box (Repository url):
https://github.com/sta-363-s23/appex-01-welcome-penguins.git
Your Turn
- Once you log on to RStudio Pro, create a new project from version control (Git)
- Paste
https://github.com/sta-363-s23/appex-01-welcome-penguins.gitin the Repository url box - Find the file pane (on the bottom right). Click the
welcome-penguins.qmdfile - Click the “Render” button
- Go back to the file and change your name on top (in the
yaml– we’ll talk about what this means later) and render again. - Then, scroll to the
plotchunk, below Palmer Penguins. Instead of looking at the relationship between flipper length and bill length, plot the relationship between flipper length and bill depth. Hint, look at the full dataset at the bottom of the document for variable names, update the captions to match your new plot. - Render again & voila!