08:00
Meet the toolkit
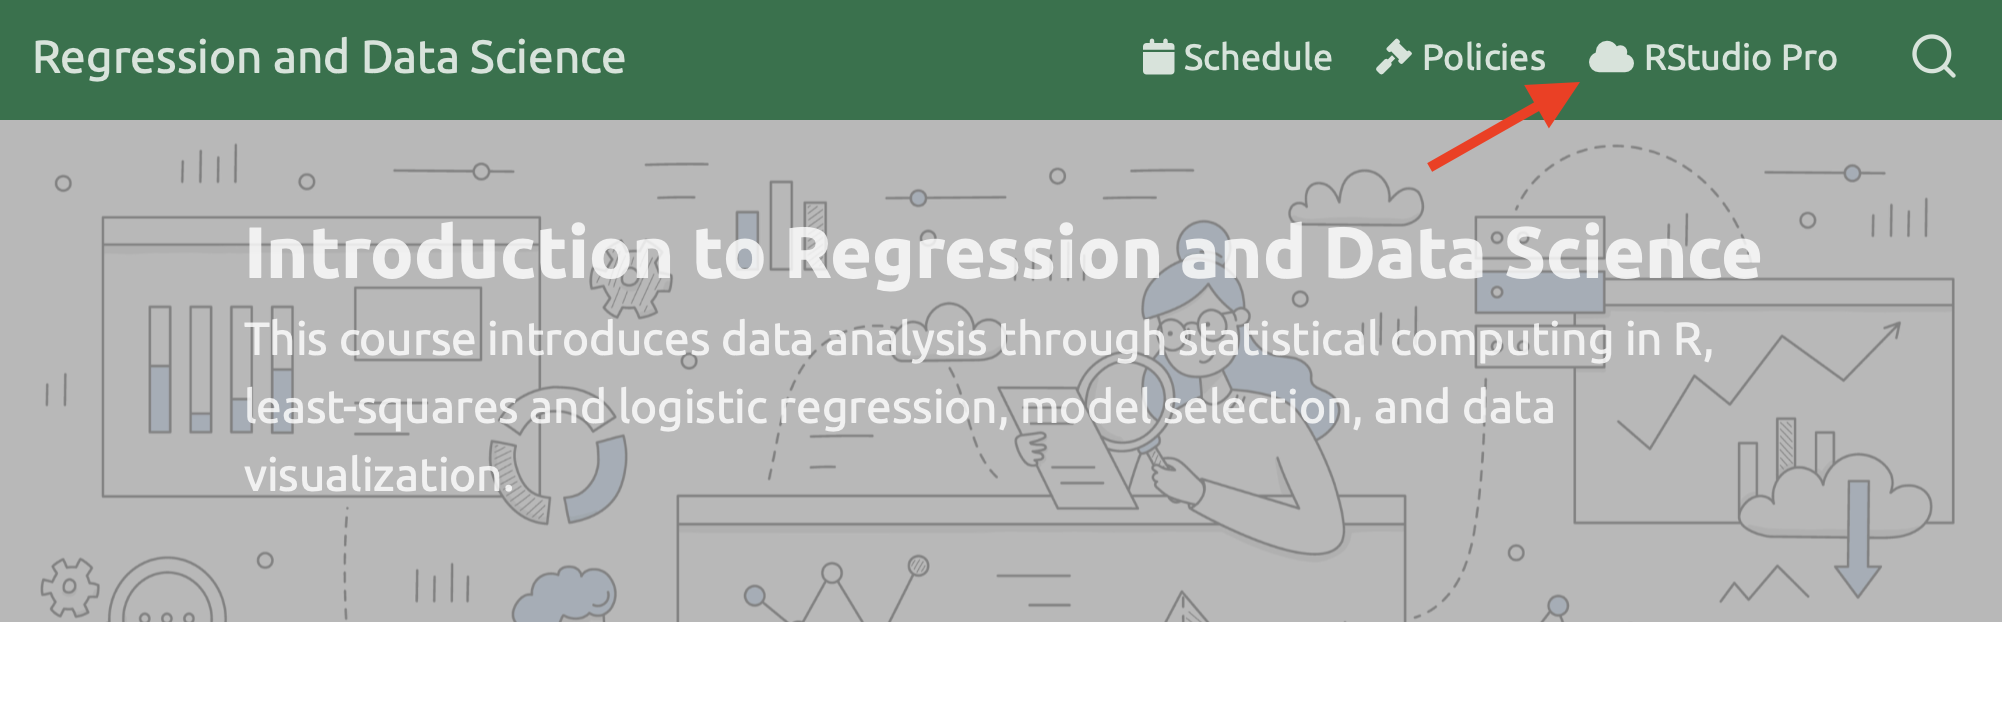
Login to RStudio Pro
- Note: if you are off campus, you will need to use a VPN to connect
- Go to https://rstudio.deac.wfu.edu/
RStudio Pro Setup
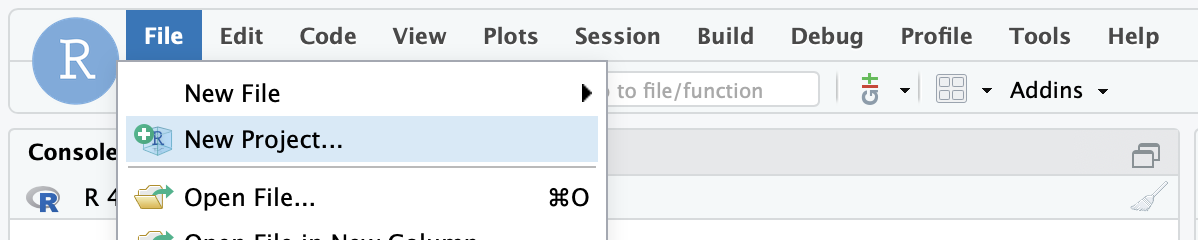
Step 1: Create a New Project
Click File > New Project
RStudio Pro Setup
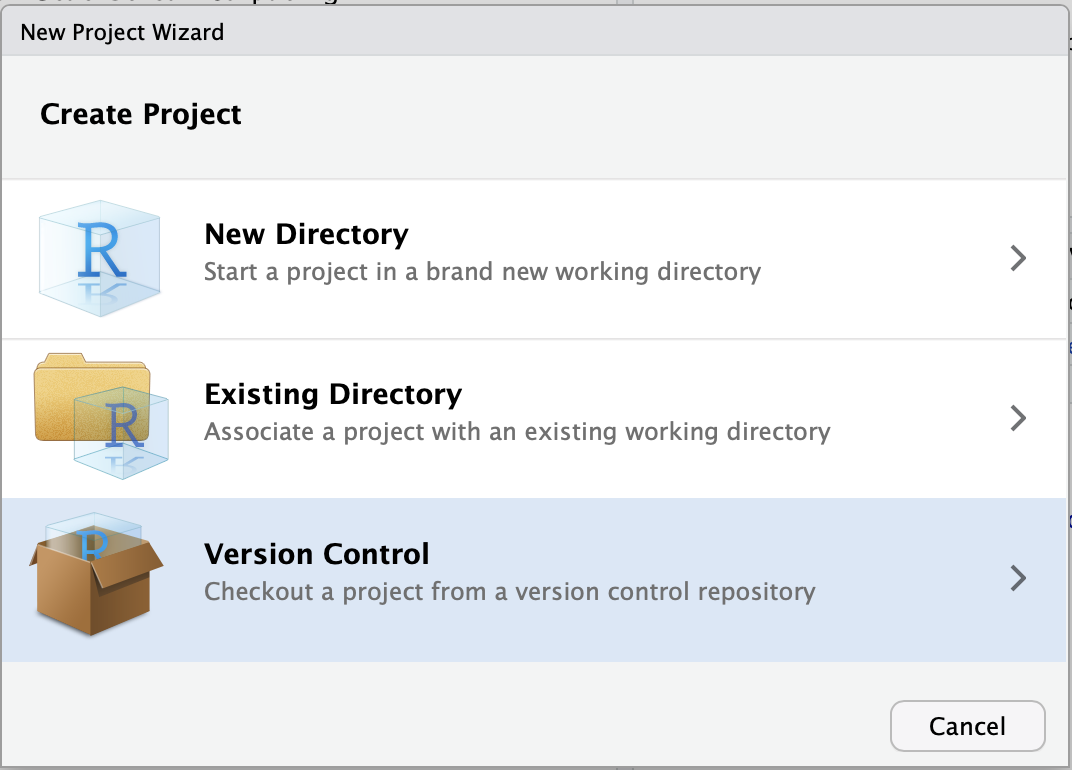
Step 2: Click “Version Control”
Click the third option.
RStudio Pro Setup
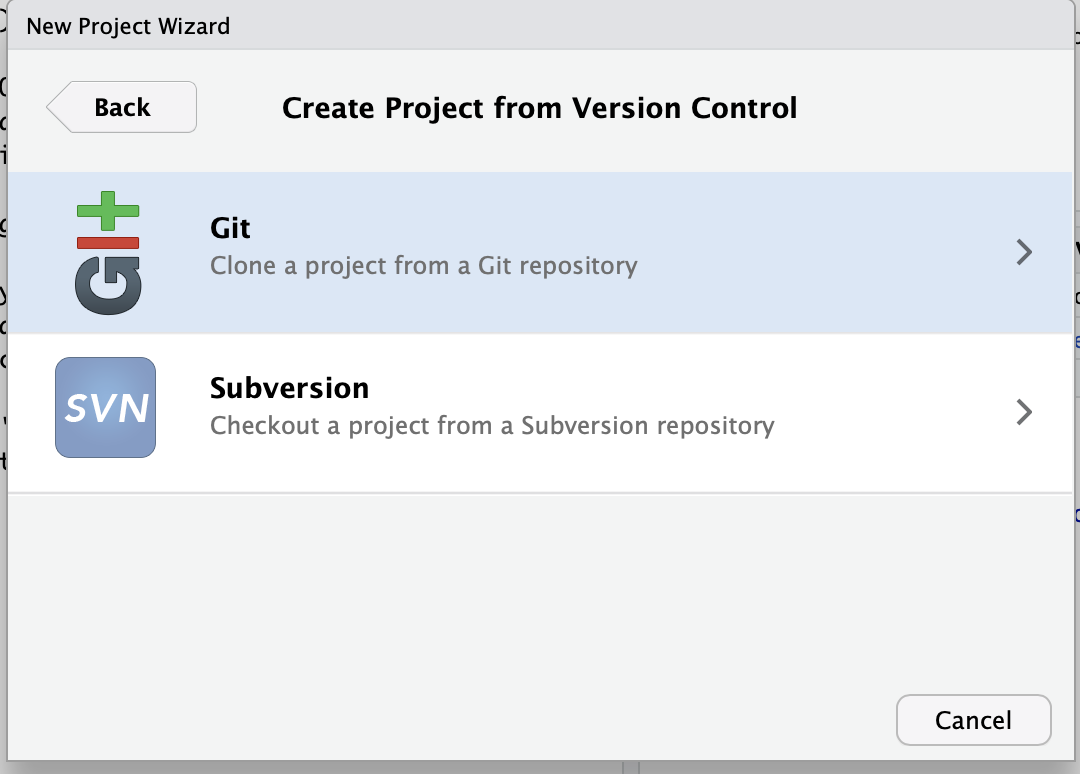
Step 3: Click Git
Click the first option
RStudio Pro Setup
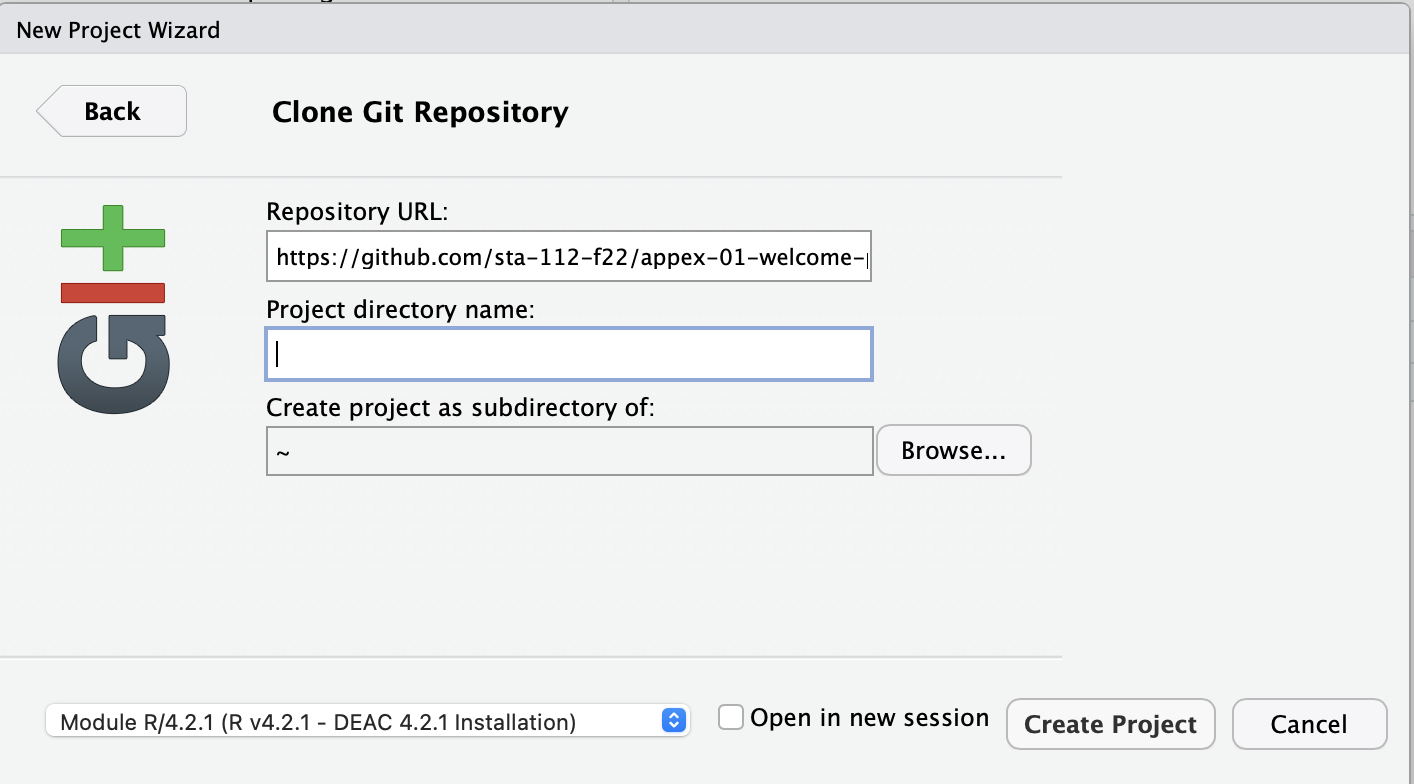
Step 4: Copy my starter files
Paste this link in the top box (Repository url):
https://github.com/sta-363-s23/appex-01-welcome-penguins.git
tidyverse
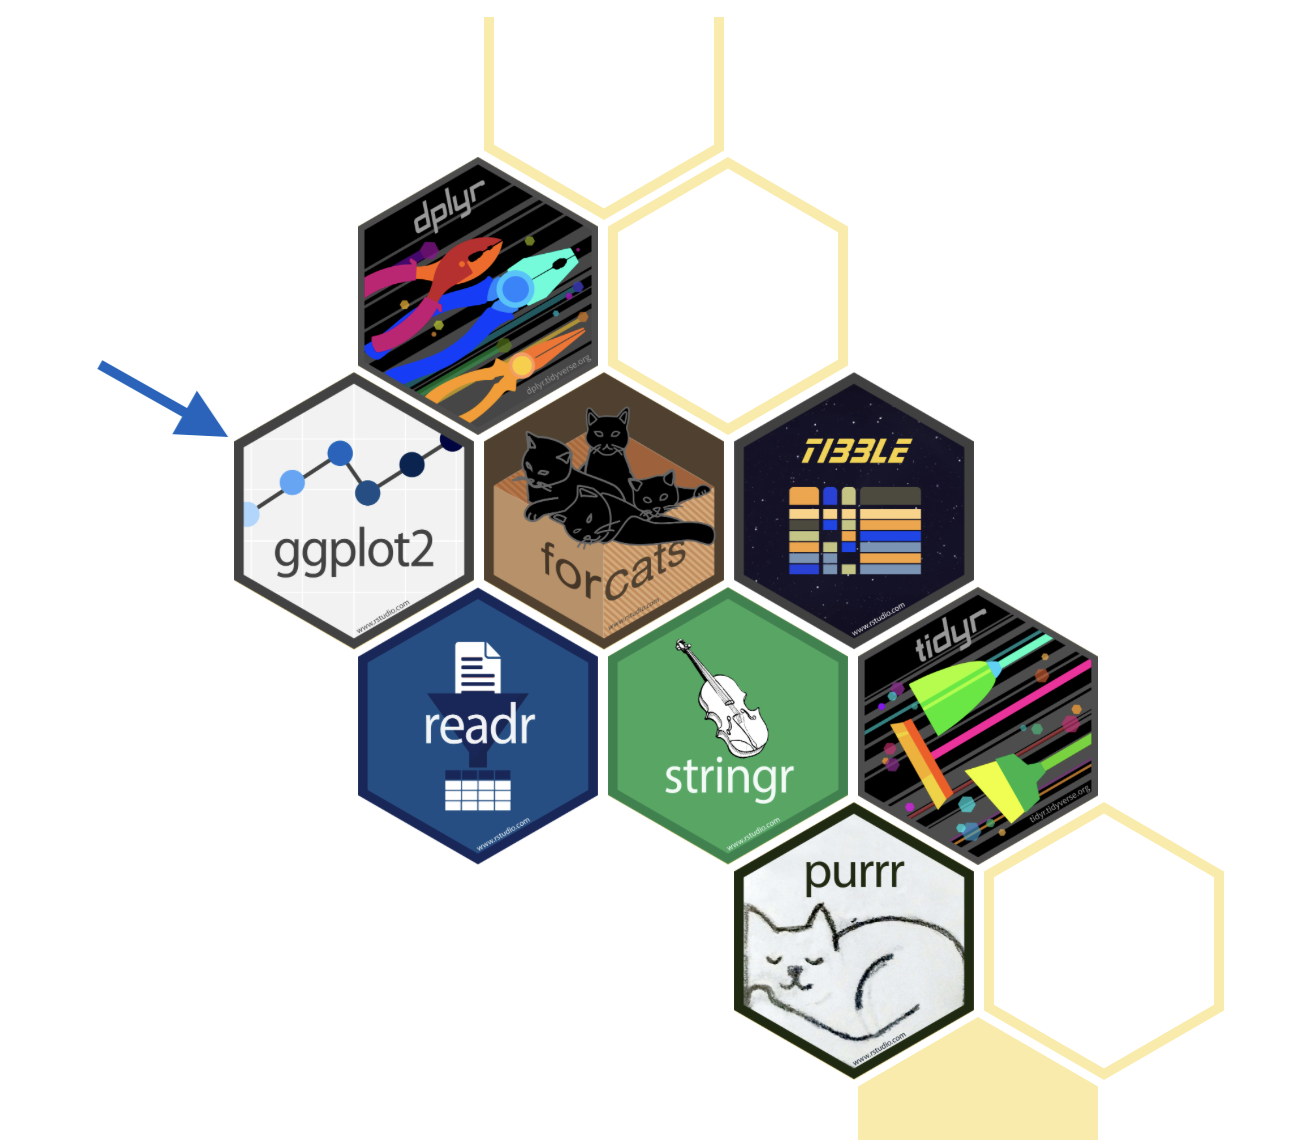
R packages for data science
The tidyverse is an opinionated collection of R packages designed for data science. All packages share an underlying design philosophy, grammar, and data structures.
Rendering
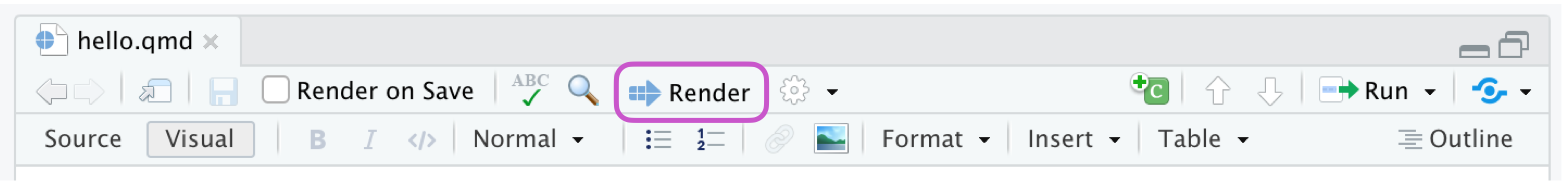
Use the ![]() Render button in the RStudio IDE to render the file and preview the output with a single click or keyboard shortcut (⇧⌘K).
Render button in the RStudio IDE to render the file and preview the output with a single click or keyboard shortcut (⇧⌘K).
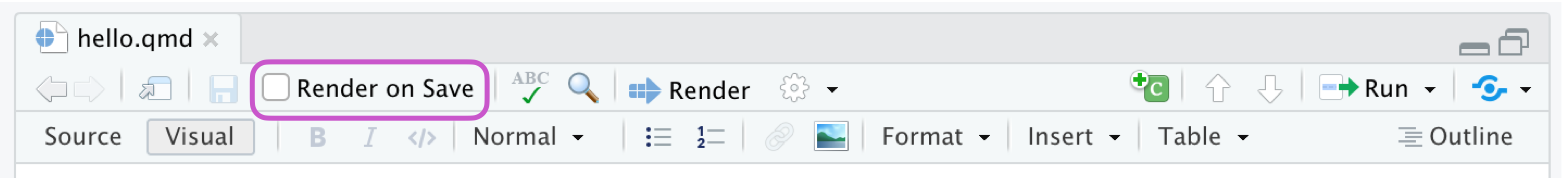
If you prefer to automatically render whenever you save, you can check the Render on Save option on the editor toolbar.
Lab 01
- Lab instructions are posted on the course website under
assignment- Let’s go find today’s!