Cross validation
Approach #1: Validation set

\[\Large\color{orange}{MSE_{\texttt{test-split}} = \textrm{Ave}_{i\in\texttt{test-split}}[y_i-\hat{f}(x_i)]^2}\]
\[\Large\color{orange}{Err_{\texttt{test-split}} = \textrm{Ave}_{i\in\texttt{test-split}}I[y_i\neq \mathcal{\hat{C}}(x_i)]}\]
Approach #1: Validation set
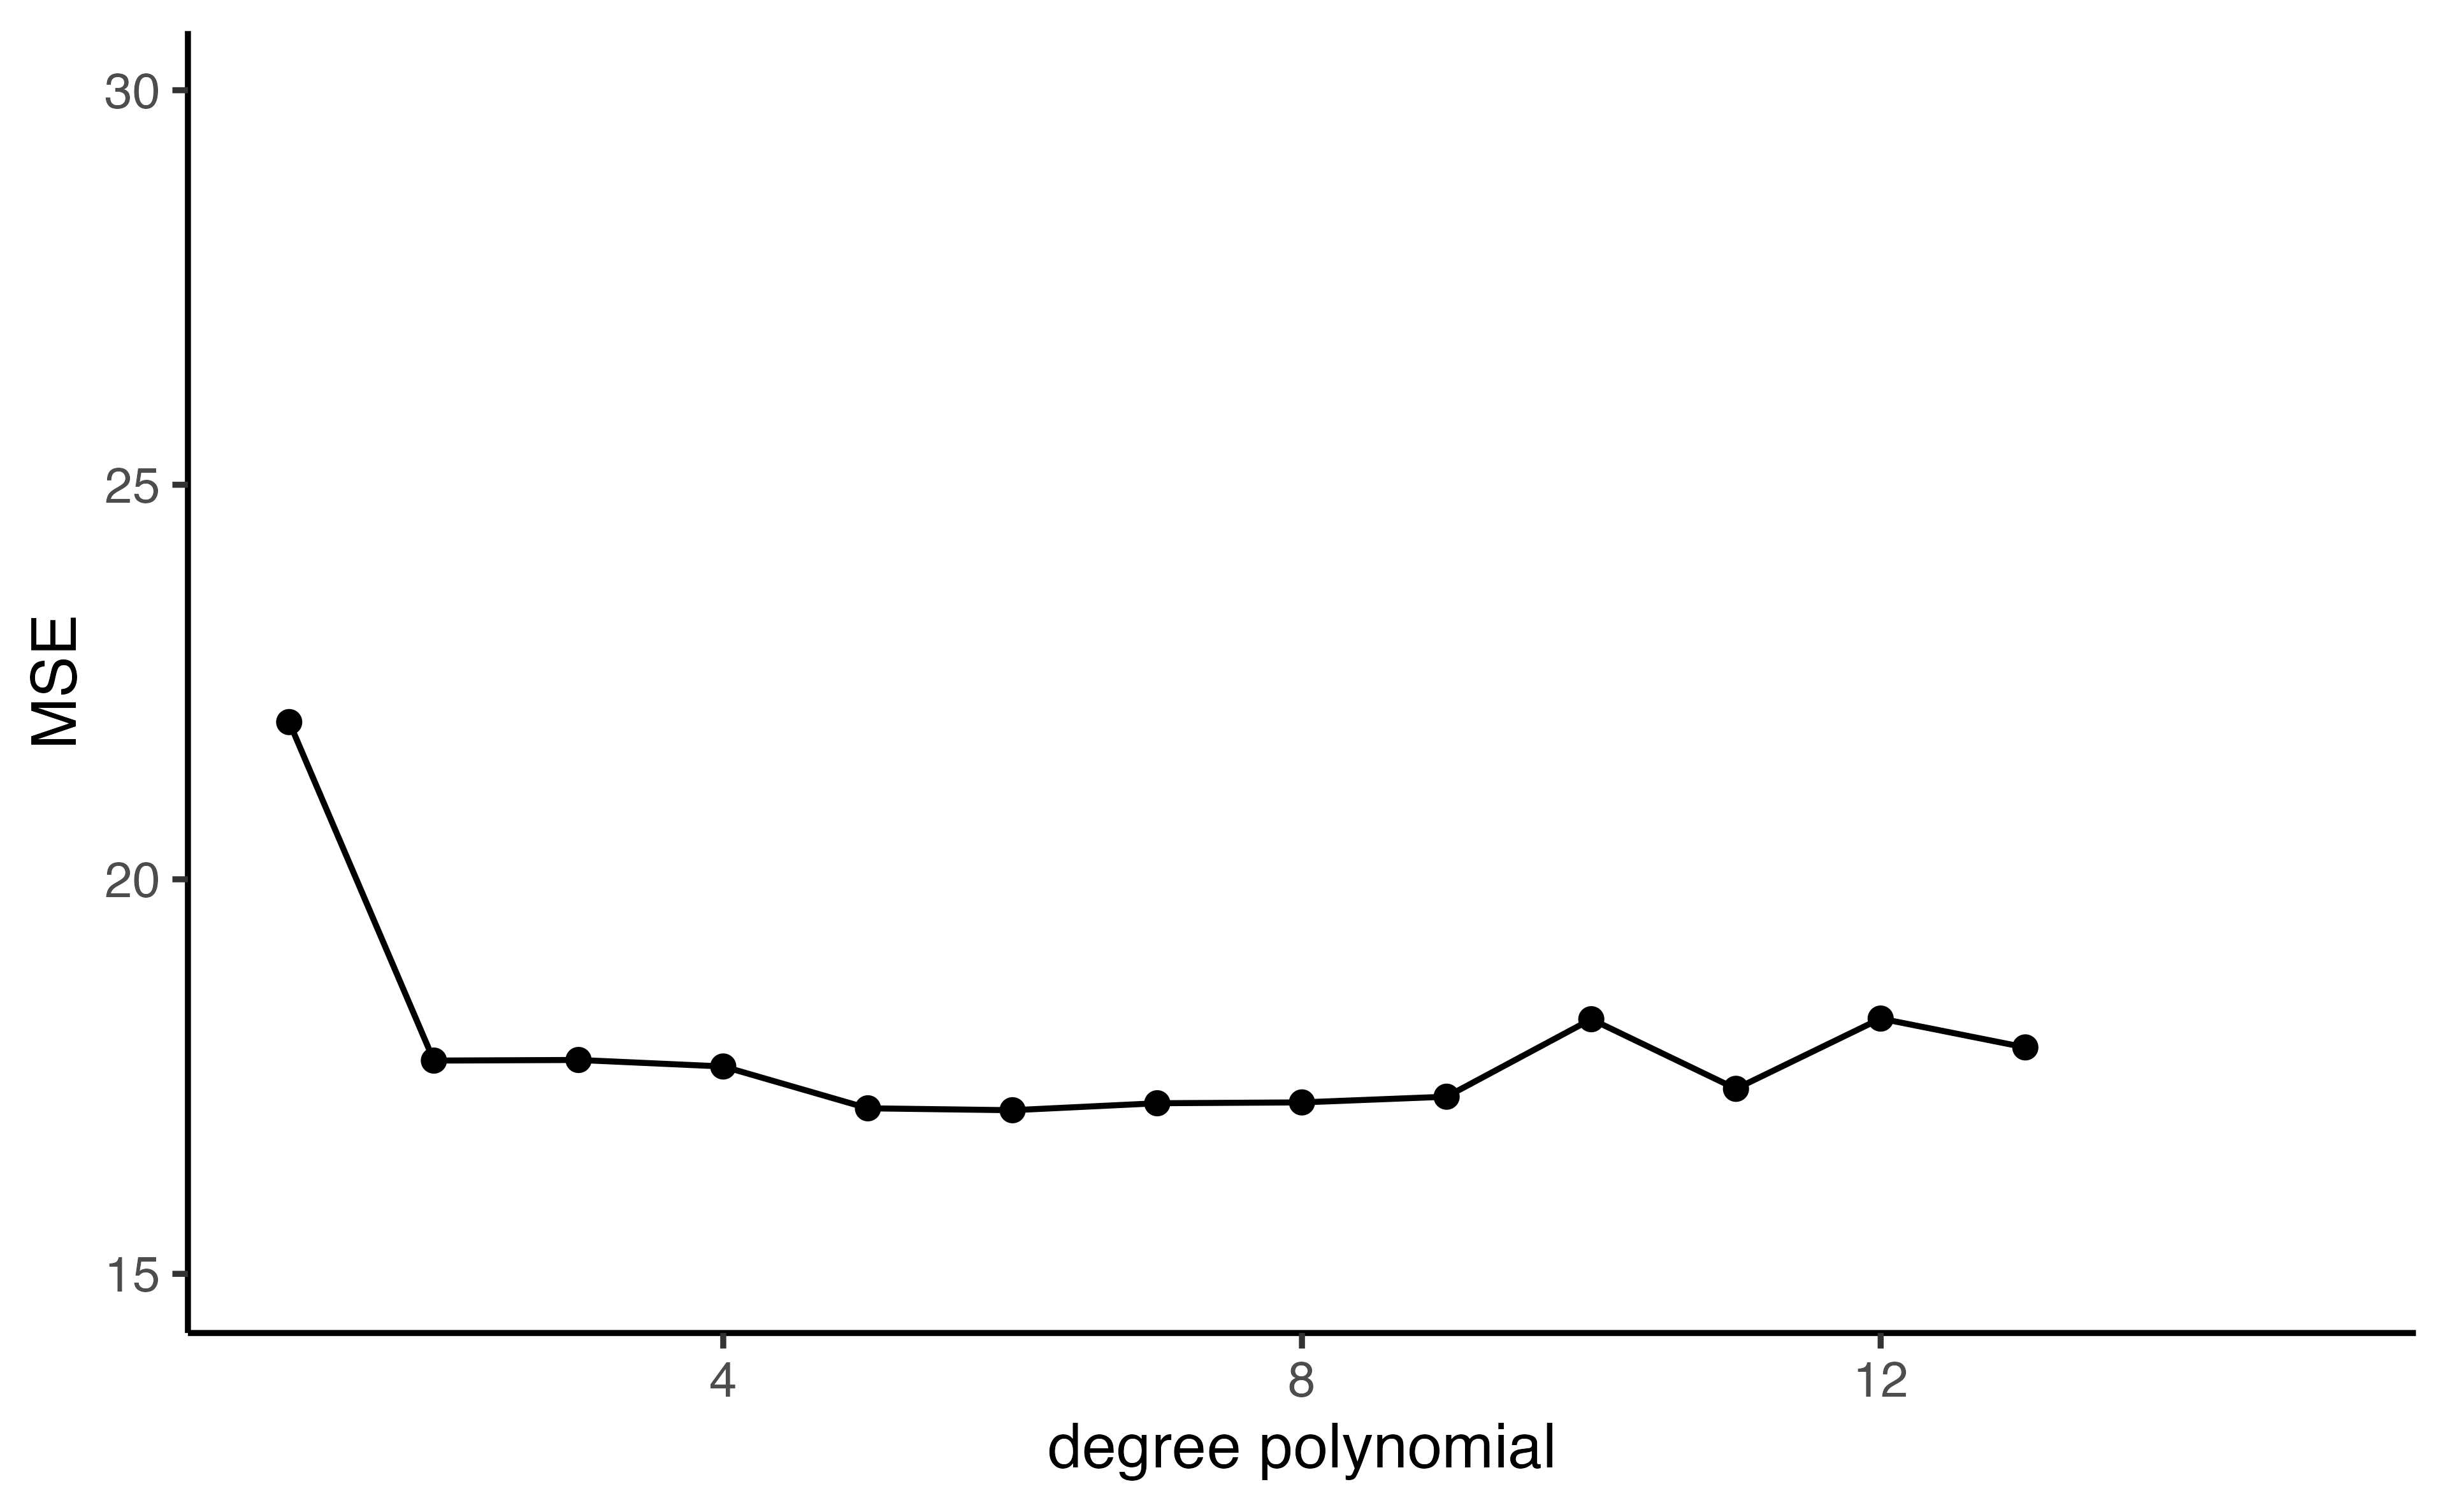
Auto example:
- We have 392 observations.
- Trying to predict
mpgfromhorsepower. - We can split the data in half and use 196 to fit the model and 196 to test
Approach #1: Validation set

\(\color{orange}{MSE_{\texttt{test-split}}}\)

\(\color{orange}{MSE_{\texttt{test-split}}}\)

\(\color{orange}{MSE_{\texttt{test-split}}}\)

\(\color{orange}{MSE_{\texttt{test-split}}}\)
Approach #1: Validation set
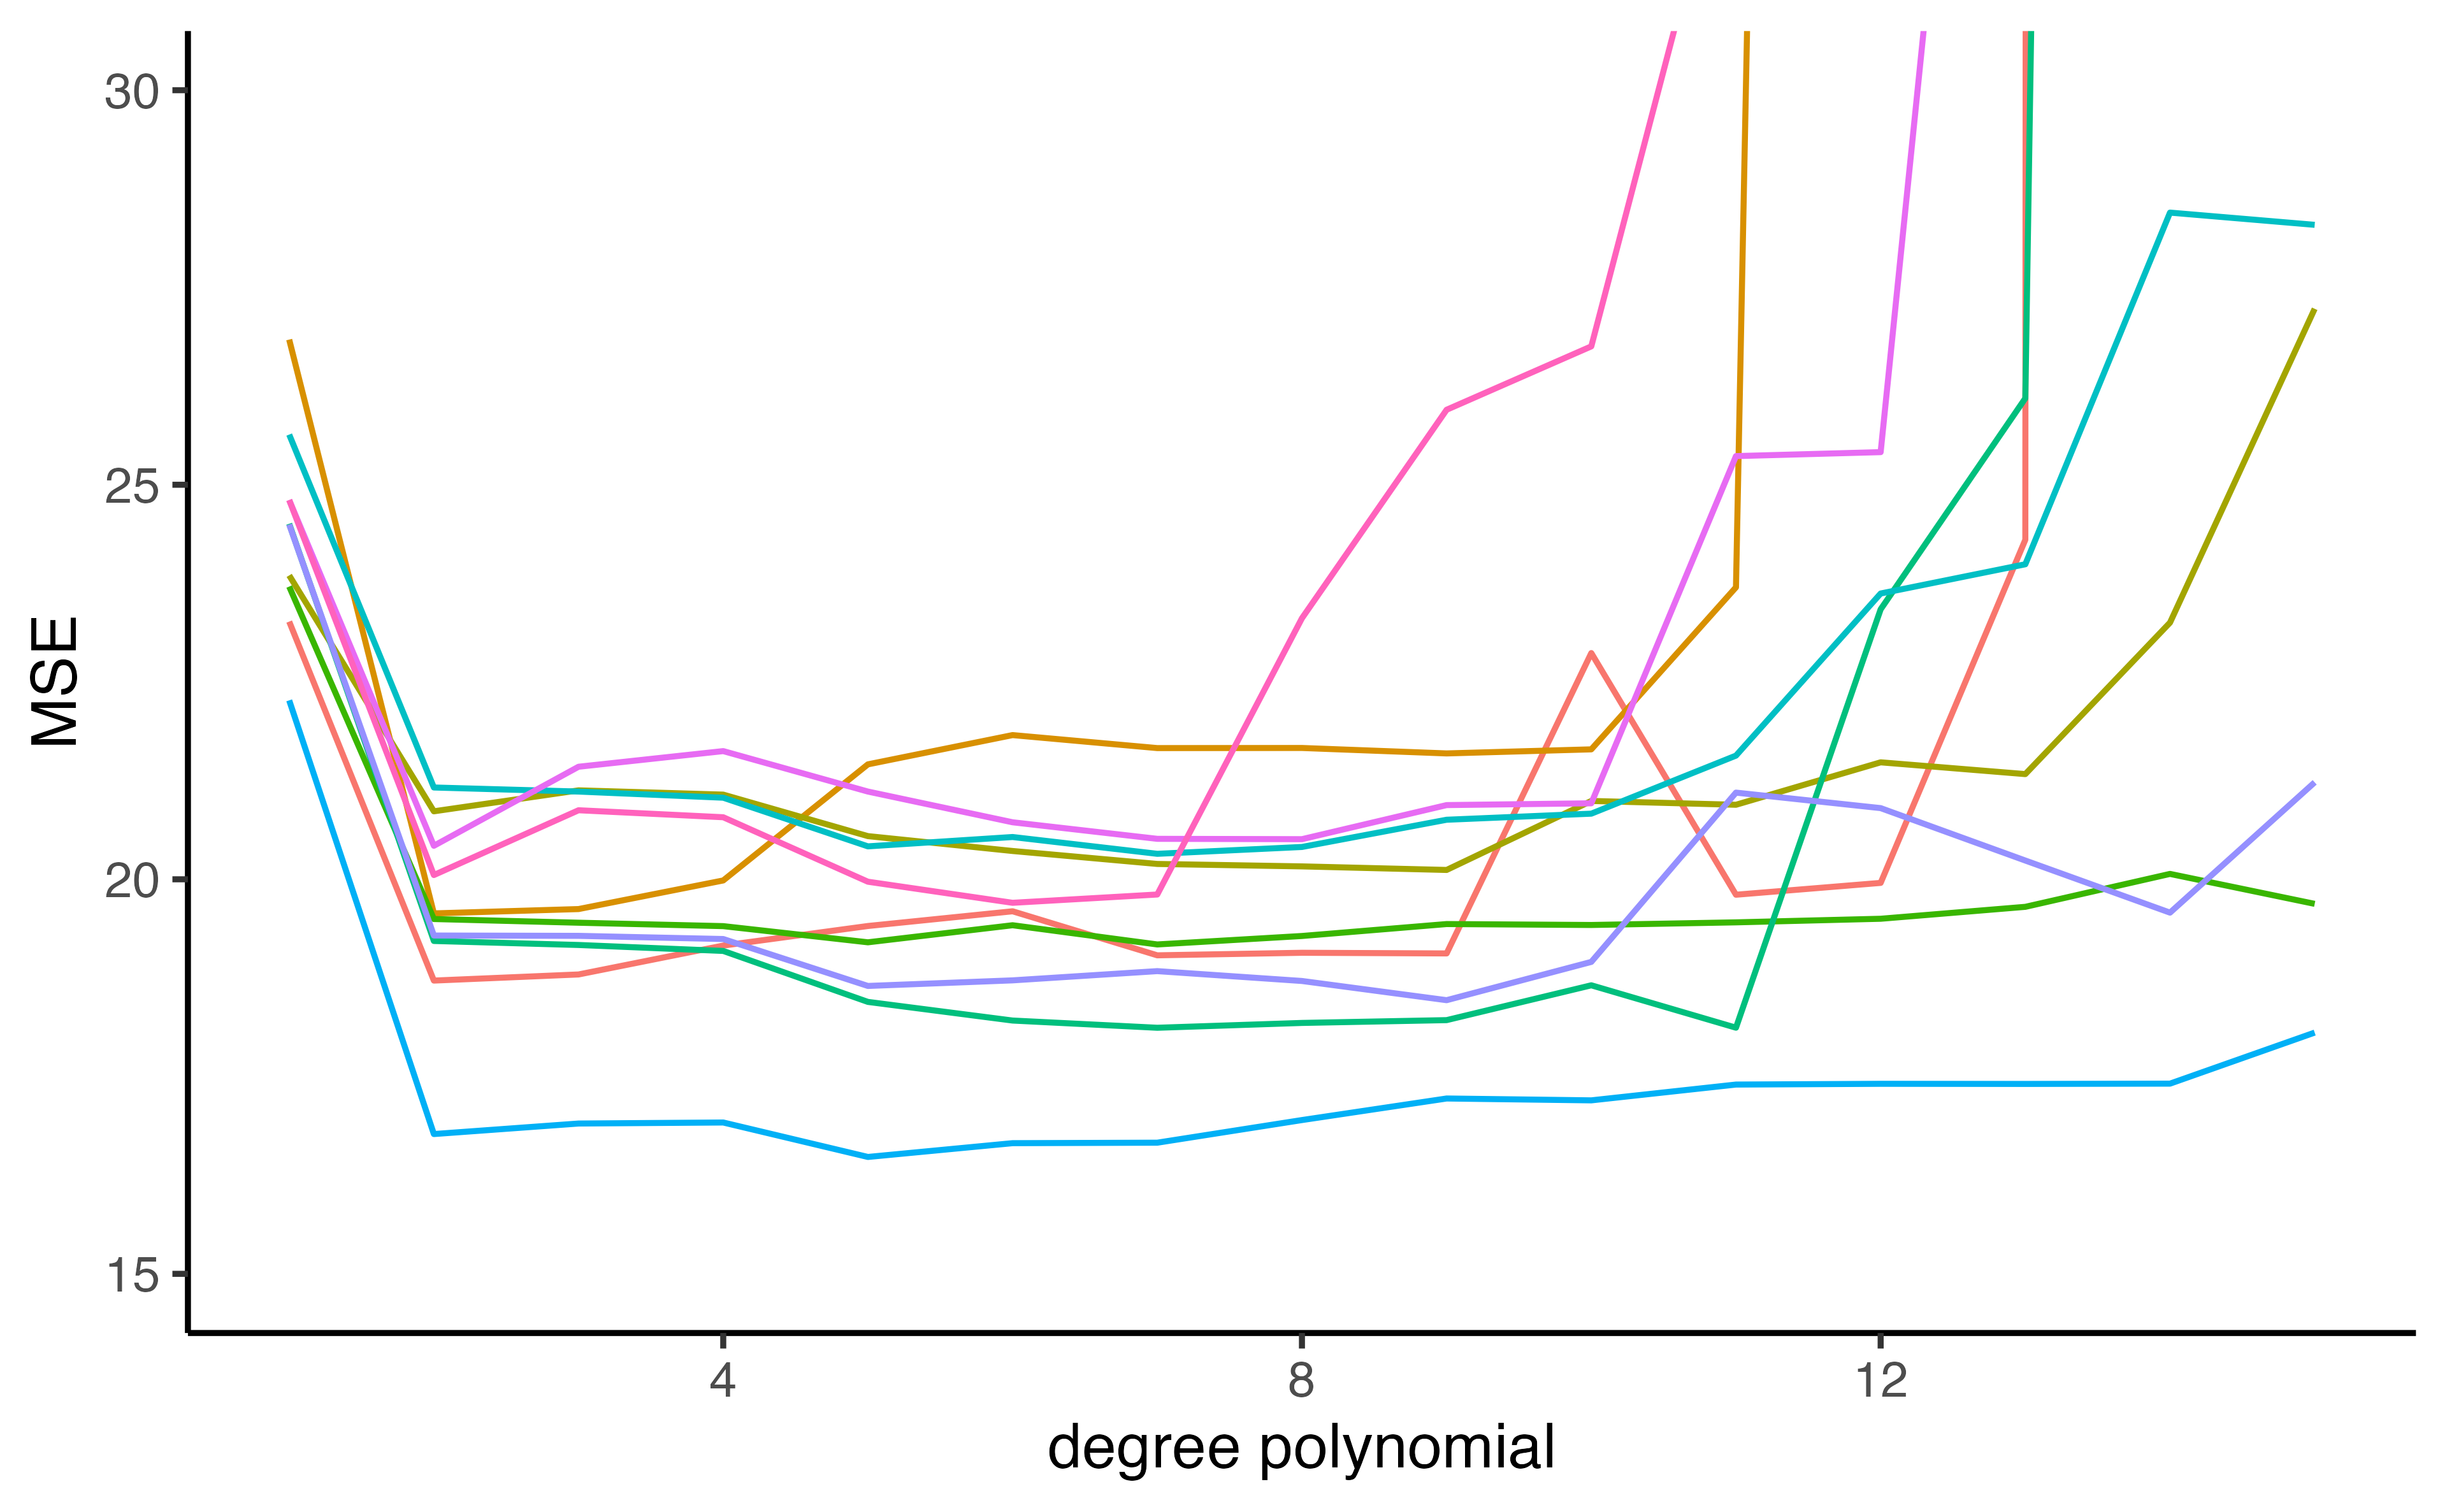
Auto example:
- We have 392 observations.
- Trying to predict
mpgfromhorsepower. - We can split the data in half and use 196 to fit the model and 196 to test - what if we did this many times?
K-fold cross validation

\(\color{orange}{MSE_{\texttt{test-split-1}}}\)

\(\color{orange}{MSE_{\texttt{test-split-2}}}\)

\(\color{orange}{MSE_{\texttt{test-split-3}}}\)

\(\color{orange}{MSE_{\texttt{test-split-4}}}\)
Take the mean of the \(k\) MSE values
Leave-one-out cross validation


\[\dots\]

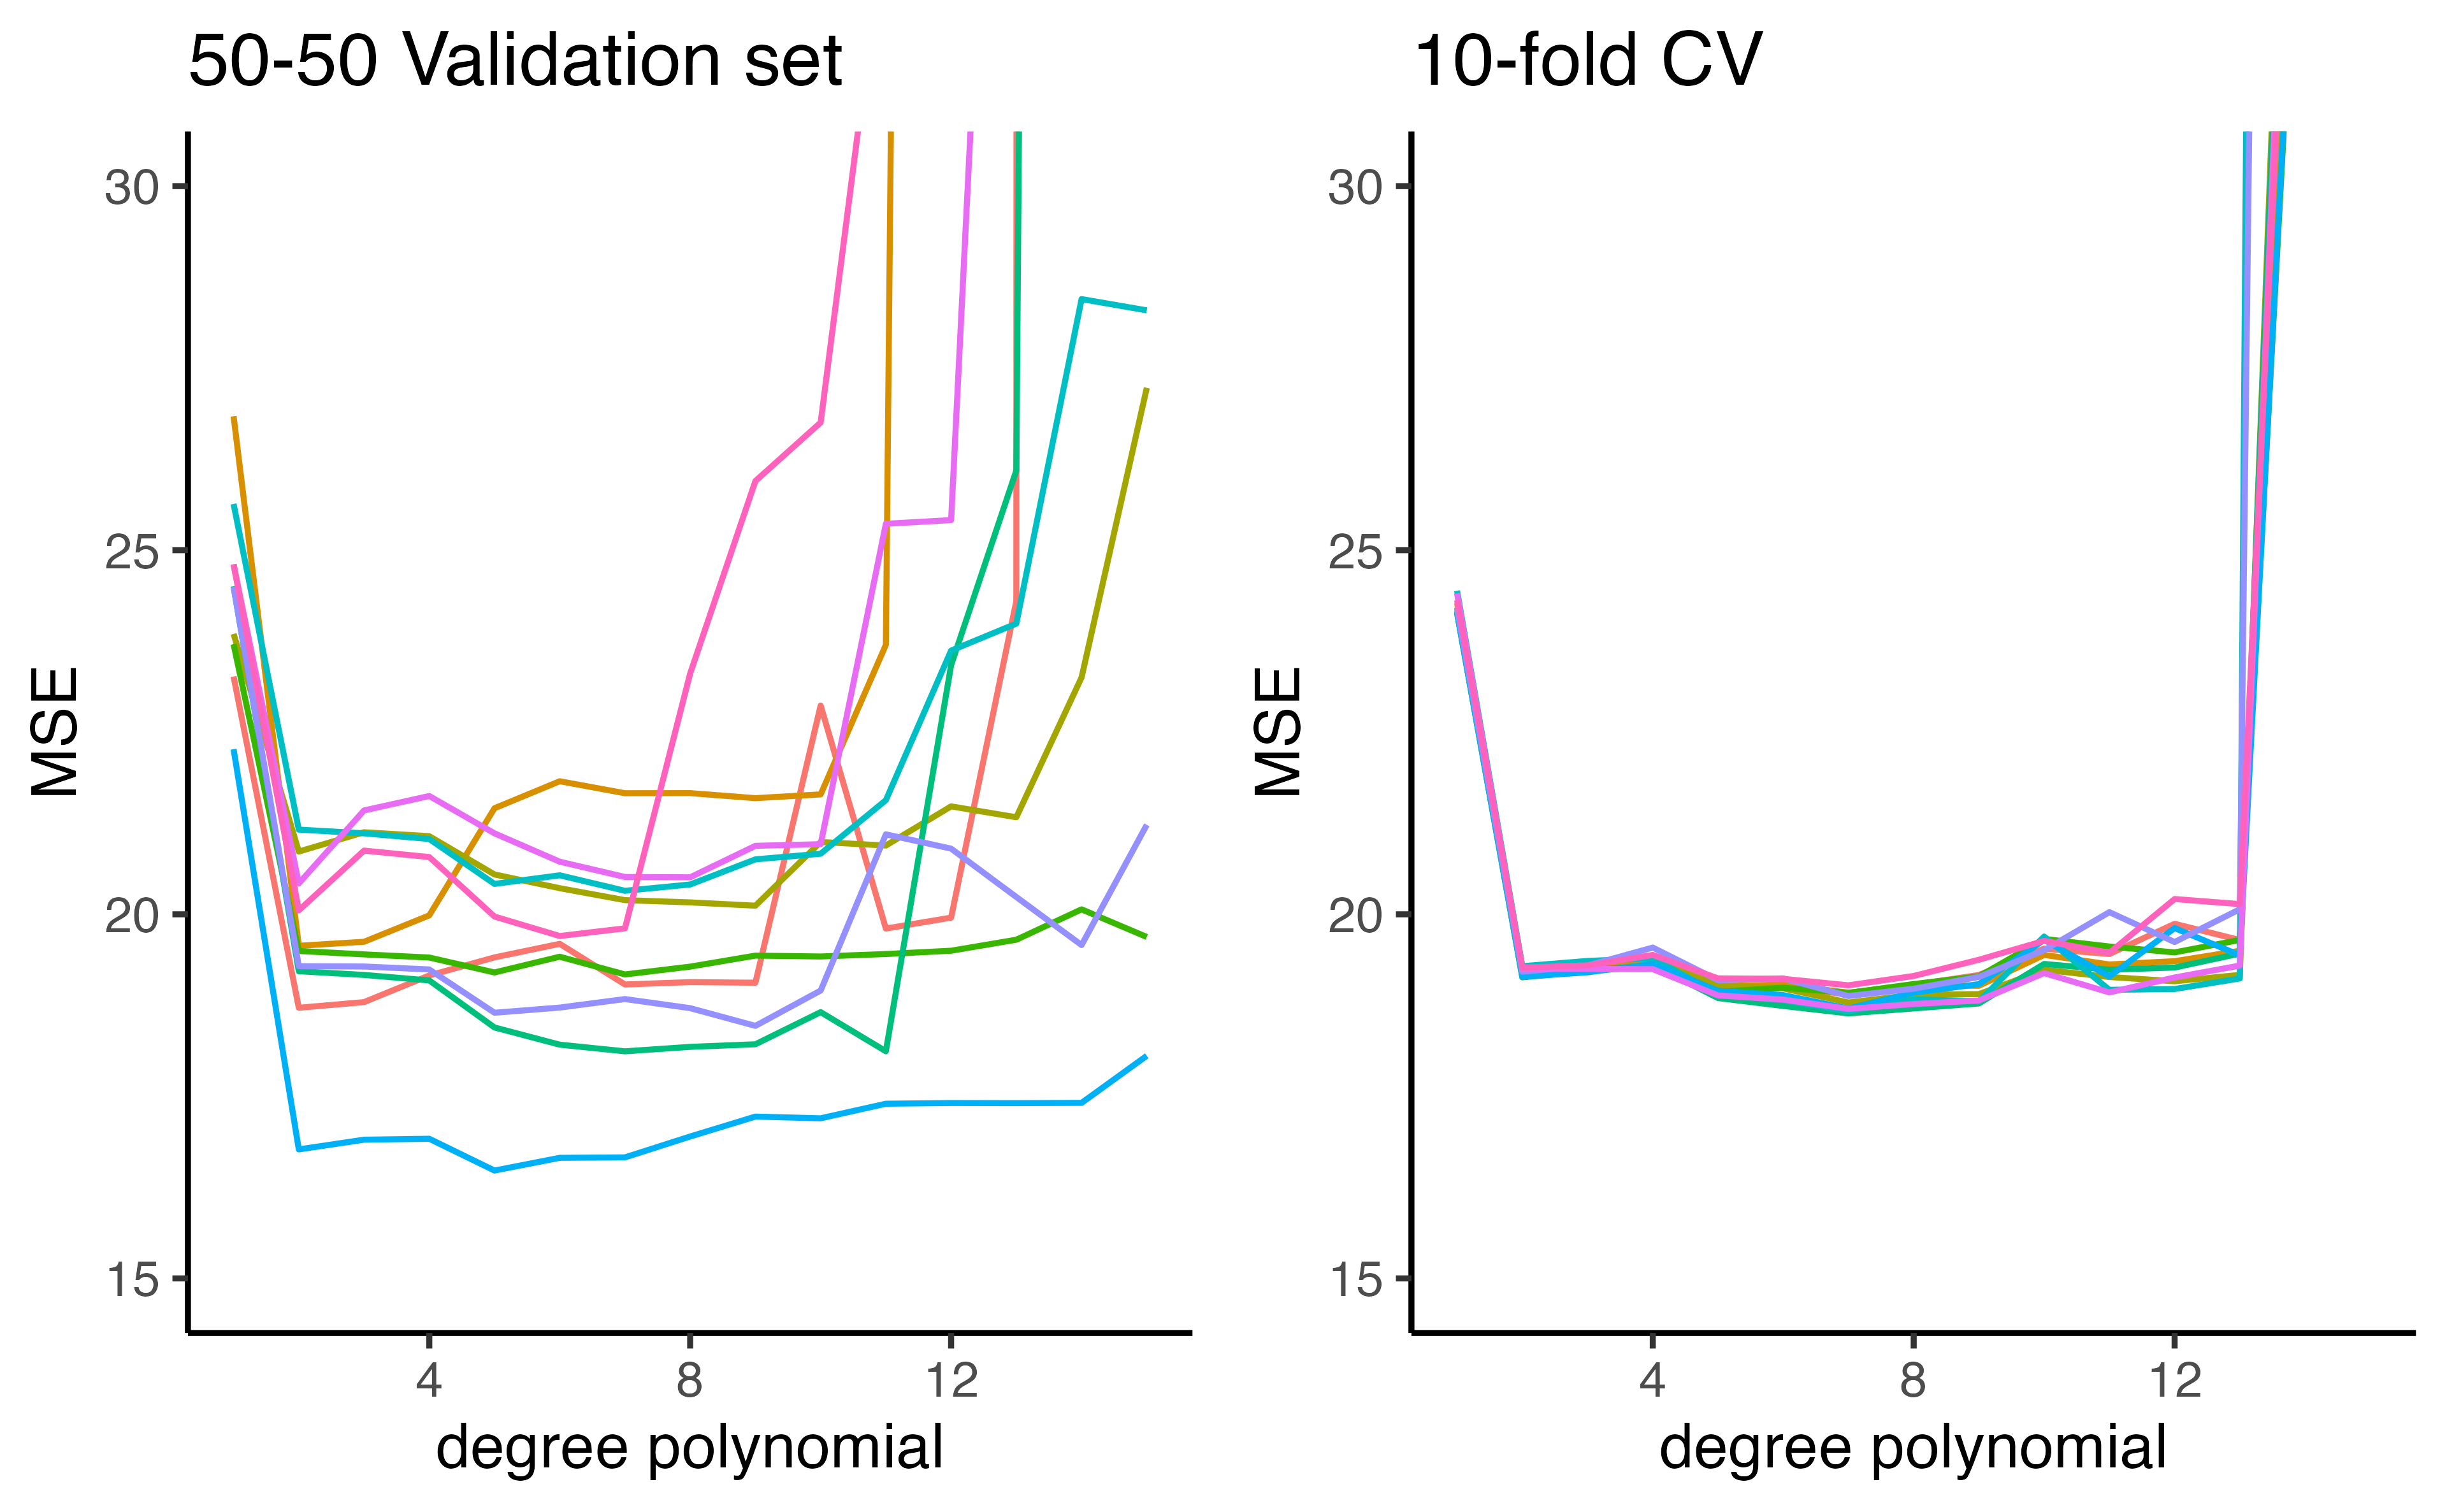
Approach #2: K-fold Cross Validation
Auto example:
- We have 392 observations.
- Trying to predict
mpgfromhorsepower
Estimating prediction error (qualitative outcome)
- The premise is the same as cross valiation for quantitative outcomes
- Split the data into K parts, where \(C_1, C_2, \dots, C_k\) indicate the indices of observations in part \(k\)
- \(CV_K = \sum_{k=1}^K\frac{n_k}{n}Err_k\)
- \(Err_k = \sum_{i\in C_k}I(y_i\neq\hat{y}_i)/n_k\) (misclassification rate)
- \(n_k\) is the number of observations in group \(k\)
- \(\hat{y}_i\) is the fit for observation \(i\) obtained from the data with the part \(k\) removed